04Method
Stated inputs, stated limits, a written answer.
Every figure in ATLAS can be traced to the data it came from and the rule that produced it.
01
Data
Each city is built from open data first: road networks, buildings, land use, population grids, satellite imagery and published soil, water and climate surveys. Client and agency data replace the open layers where they exist, and every layer keeps its source and date.
02
Grading
Land and sites are graded against limits taken from published standards. Each factor is rated on its own, the weakest factor sets the grade, and the limiting factor is named beside it. Distances are measured on the road network, not drawn as circles.
03
Monitoring
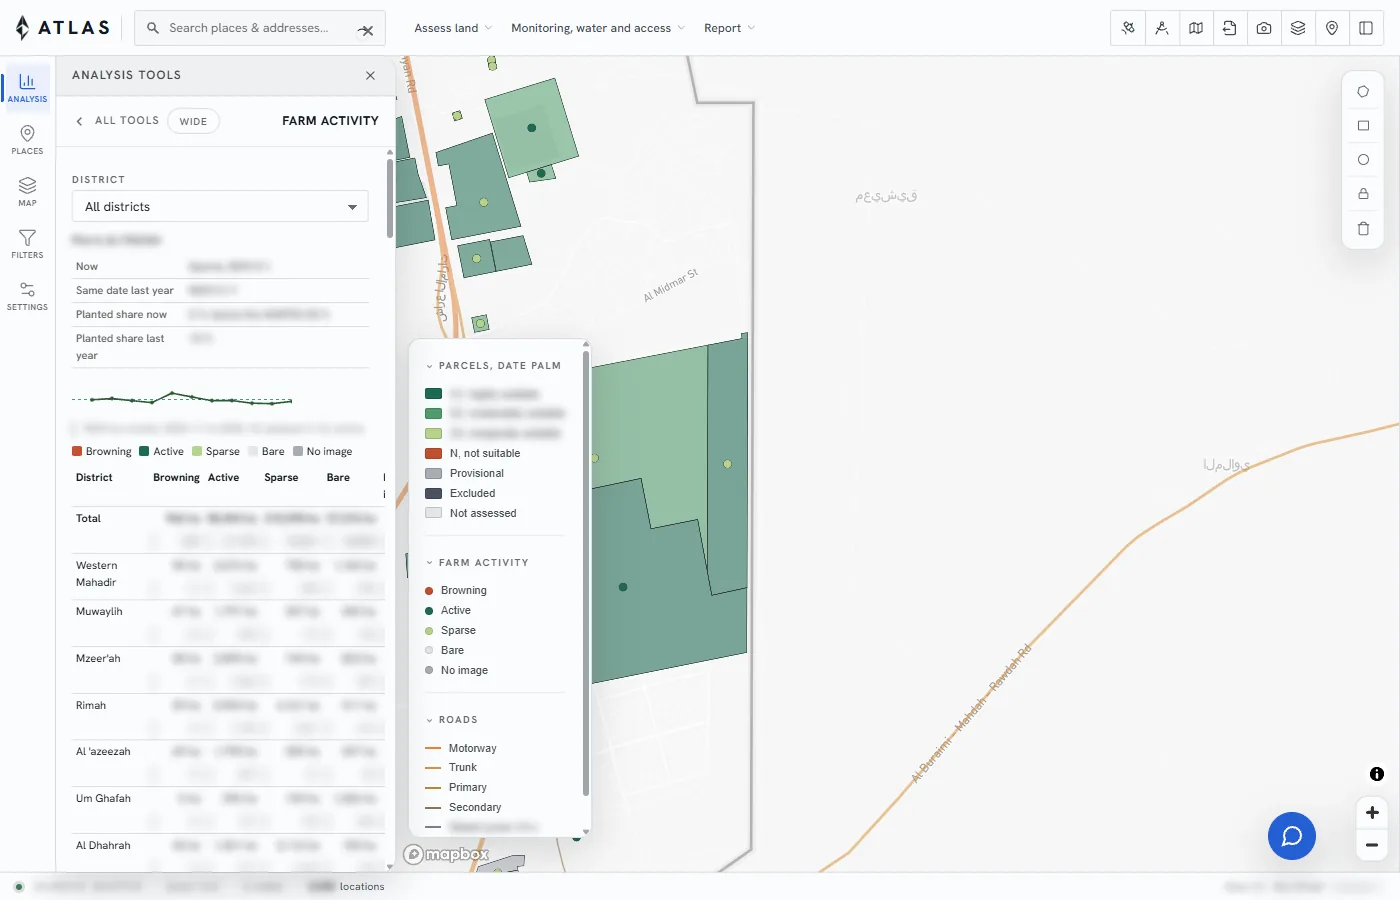
Satellite imagery is read every month. A parcel or a district keeps its record over time, so a change is seen against the months before it.
04
Report
Every tool writes its answer into an A4 report: maps, tables, the inputs used, the sources, and what was not measured.